The genetic architecture of the brain

Genes play a big role in determining the architecture of our brain: the way it’s folded, the thickness of the outer layer, and the way different brain areas are connected. By combining data from all over the world, a large collaboration of researchers from the ENIGMA consortium has now identified almost 200 genetic variants that are involved in this brain architecture. These findings can help us to further understand the genetics of brain disorders. 

Our genes contain the blueprint of our bodies. They contain information about how our cells function, and they determine for instance the colour of our eyes and hair, or whether we like cilantro (coriander) and bitter tastes. For some traits we know very well how they are influenced by genes. Eye color for instance is coded by only a few genes. But for many other traits such as height and personality, many different genes are involved. In addition, other (non-genetic) factors also influence these traits, such as malnutrition that can cause stunted growth.

The architecture of the brain is influenced by a large numer of genes, of which we still know very little. To investigate this, researchers combined genetic data of over 50.000 individuals with MRI-data. MRI-scans can show in detail the thickness of the outer layer of the brain, where all the brain cells are (also called the grey matter). They can also be used to measure how much this layer is folded, which gives information about the total surface of this outerlayer. This brain architecture is unique to every individual. The extent of the folds and the thickness of the outer layer have previously (in other research studies) been linked to cognitive abilities and various neurological and psychiatric disorders, such as Alzheimer’s disease, schizophrenia, depression, autism, and ADHD. It is therefore helpful to understand the genetics of this architecture, because it will help us to better understand the genetic mechanisms of these conditions.

The findings from this research study are also explained in this video:

This important research can only be done by combining a lot of data and collaborating with a large number of scientists and institutes. The ENIGMA consortium has been set upt to facilitate this kind of world-wide collaboration. The research that has now been published is the combined effort of more than 360 scientists from 296 departments across 184 different institutions and universities. They also made their results downloadable so that everyone who is interested can have a closer look.

The full publication can be found here: https://science.sciencemag.org/content/367/6484/eaay6690

See also our previous blogposts about these topics:


On a coalmine and an MRI scanner – Is it fun, participating in DELTA? (2)

About two and a half years ago, Dr. Emma Sprooten started the DELTA project. In DELTA, acronym for Determinants of Long-term Trajectories in ADHD, she investigates factors that contribute to the difference in (severity of) symptoms and impairment in people who were diagnosed with ADHD as a child. Previously, these adults participated in a study called NeuroImage when they were a child. We asked them if they were willing to participate one more time in this study. We will post three blogs about the project. This is blog 2.

What happens on a test day?

Back to Essen, autumn 2019. Our participants receive a letter with an indication of the address and a photo of the exact building. Even then, a lot of them seem to be somewhat confused. Is the appointment really here, in this place? Yes, the 7 Tesla MRI scanner that can produce super detailed images happens to be here. On the premises of an old coalmine, that is now a UNESCO world heritage site, as we’ve seen last week.

When everyone has arrived, we start with coffee. Long travels make thirsty, right? While we serve coffee, participants fill in a form with questions about their health. This is to make sure that their health is compliant with the German safety rules to undergo a 7 Tesla MRI scan.

When we enter the scanner room wearing shoes that contain metal parts, we can actually feel that this scanner has a very strong field strength: some shoes make you feel like wading through water! This strong field strength is why participants wear the green or blue clothes that surgeons wear in the operation theatre. A lot of ‘normal’ clothing has metal parts (such as zippers) or invisible metallic microfibers. This would give distortions on the data we gather or, even worse, can cause burns on their skin.

Going into the scanner is a special experience too. Because of the strong magnetic field, you may feel dizzy when moving into the scanner. One of our participants told afterwards: ‘I was really a bit confused: huh, I didn’t use drugs, what’s happening!?’ Compared to the 3 Tesla scanner in Nijmegen, where we also make an MRI scan, participants are placed quite a bit deeper into the bore of the scanner. Their whole body actually is inside the tunnel. So not having claustrophobia is also important. The participants spend the next 45 minutes in the dark, accompanied by loud rhythmic noise, until the scan is finished.

Time for lunch. During lunch, we transfer the data from the scanner to our hard drive, so that we can take it back to Nijmegen. Because the scanner registers the brain in such a detailed and precise manner, it generates a lot of data. The files that the scanner generates are so big that it lasts about half an hour to transfer the files!

Lunch is also a good time to have an informal chat about how the first day of testing – in Nijmegen – had been. During the first test day in Nijmegen, we also make an MRI. This MRI is made on a 3 Tesla scanner. In Nijmegen the scan consists of a part where you can just lie down and a part where you, still lying down, do some mental exercises. In that first part we measure brain anatomy and the activity of the brain at rest. During the mental exercises, we measure what happens in the brain while performing the exercise. Next to scanning we ask participants to fill in questionnaires, and do some tests to measure their IQ. We also do clinical interviews to assess the presence of ADHD symptoms and possible comorbid disorders.

After lunch we usually schedule one of the clinical interviews that are part of the project. When this is finished, it is time to head back to Nijmegen!

While collecting the data, we learn a lot about how people integrate ADHD in their lives. We feel honored by all these people telling us their life stories and helping us by participating in our project. Some participants tell us that they learned more about themselves or gained new insights. A compliment that makes us grateful.

Next week, we will explain why we drive all the way to Essen with our participants, and provide you with some information on the content of the project.

On a coalmine and an MRI scanner – Is it fun, participating in DELTA?

About two and a half years ago, Dr. Emma Sprooten started the DELTA project. In DELTA, acronym for Determinants of Long-term Trajectories in ADHD, she investigates factors that contribute to the difference in (severity of) symptoms and impairment in people who were diagnosed with ADHD as a child. Previously, these adults participated in a study called NeuroImage when they were a child. We asked them if they were willing to participate one more time in this study. In the coming three weeks, we will post three blogs about the project. This is blog 1.

2019. Somewhere in autumn. Trees have become all shades of brown, yellow and red. We pass forests while driving on a German highway, all the way from Holland. After a while, the landscape changes from the colored forest to an industrial town. It is grey and gloomy, packed with old-fashioned industry buildings. Soon, the navigation sends us into an even more surreal place. We find ourselves surrounded by rusty brown pipes in a place that feels like an abandoned factory. If we would not know better, we would begin to feel a bit worried about what could happen here… 

What brings us here in this desolate area? To put it short, a bunch of people who were diagnosed with ADHD during their childhood, and a hypermodern 7 Tesla MRI scanner. Over ten years ago, as children, our participants first came in together with their parents and siblings. They played games, were interviewed and got an MRI scan, that was presented to them as ‘ a picture of the inside of your brain’. Now, we are repeating these measurements for a third time, with an upgrade from 3 Tesla to 7 Tesla MRI, allowing even more detailed pictures of their brains.

For scientists it is extremely valuable that people are willing to take part in this research. This is one of the few cohorts in the world in which people with ADHD are followed up for such a long time. It makes it possible to investigate which factors influence the different clinical trajectories that ADHD can take:. We are now testing people for already a third time in the NeuroImage project, that started in 2009. The current follow-up is called the DELTA project. More on the content of the project in our third blog. 

Next week, we’ll give you a peek into what a participant experiences during a test day in Essen. 

If you cannot wait to get some information on NeuroImage, see: https://www.ru.nl/donders/vm-site/collaborations/projects/neuroimage/

For a peak into Zollverein, the world heritage site where the 7 Tesla scanner is located, see: https://www.zollverein.de/zollverein-unesco-world-heritage-site/ The photo at the top of this post shows a detail of the coal mine at Zollverein.

The cortex and ADHD: the second project of the ENIGMA-ADHD collaboration.

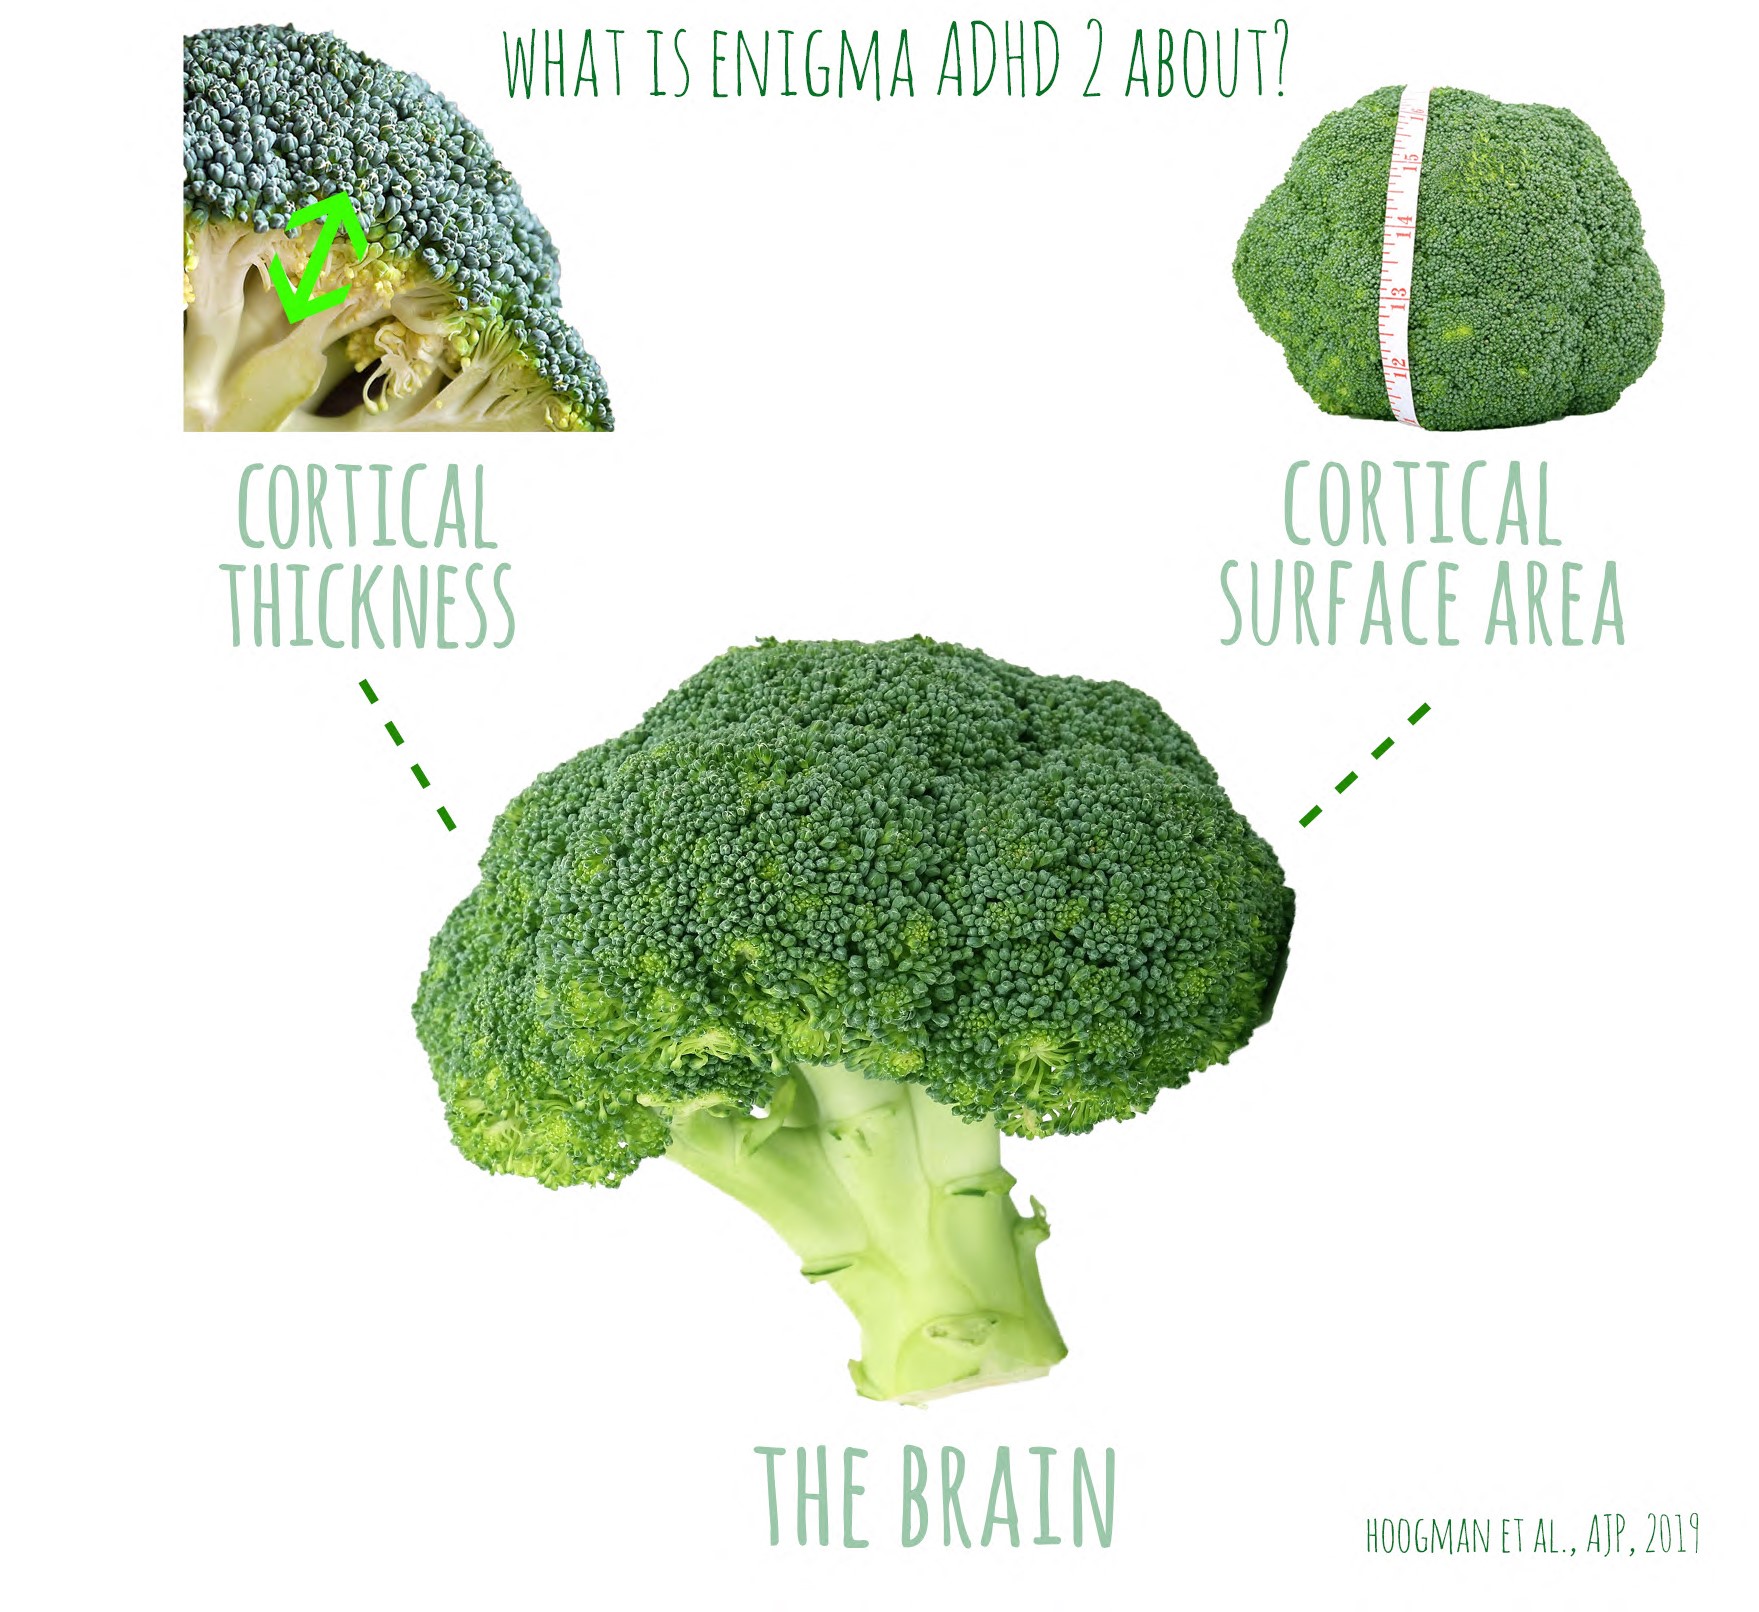
After the first project on subcortical brain volumes in ADHD, published in Lancet Psychiatry in 2017 , ENIGMA-ADHD now analysed cortical data of 2246 people with a diagnosis of ADHD and 1713 people without, aged between four and 63 years old.  The data came from 37 research groups from around the world. FreeSurfer (imaging software) parcellations of thickness and surface area of 34 cortical regions were compared between cases and controls in 3 separate age groups; children, adolescents and adults.

ENIGMAADHD2JPG

Subtle differences only in the group of children were found. The childhood effects were most prominent and widespread for the surface area of the cortex. More focal changes were found for thickness of the cortex. All differences were subtle and detected only at a group level, and thus these brain images cannot be used to diagnose ADHD or guide its treatment.

These subtle differences in the brain’s cortex were not limited to people with the clinical diagnosis of ADHD: they were also present – in a less marked form – in youth with some ADHD symptoms. This second finding results from a collaboration between the ENIGMA-ADHD Working Group and the Generation-R study from Rotterdam, which has brain images on 2700 children aged 9-11 years from the general population. The researchers found more symptoms of inattention to be associated with a decrease in cortical surface area. In a third study, using the NeuroImage data from Nijmegen and Amsterdam, familial effects on those regions that showed case-control differences were investigated.  Siblings of those with ADHD showed changes to their cortical surface area that resembled their affected sibling. This suggests that familial factors such as genetics or shared environment may play a role in brain cortical characteristics.

We identified cortical differences that are consistently associated with ADHD combining data from many different research groups internationally. We find that the differences extend beyond narrowly-defined clinical diagnoses and are seen, in a less marked manner, in those with some ADHD symptoms and in unaffected siblings of people with ADHD. This finding supports the idea that the symptoms underlying ADHD may be a continuous trait in the population, which has already been reported by other behavioural and genetic studies.’ In the future, the ADHD Working Group, which is led by Martine Hoogman and Barbara Franke from the Radboudumc in Nijmegen, hopes to look at additional key features in the brain- such as the structural connections between brain areas – and to increase the representation of adults affected by ADHD, in whom limited research has been performed to date.

Link to the article: Hoogman et al., Brain Imaging of the Cortex in ADHD: A Coordinated Analysis of Large-Scale Clinical and Population-Based Samples

To learn more about other projects that are carried out using ENIGMA-ADHD data, please also read the paper by Yanli Zhang-James and colleagues on bioRxiv. Here, the ENIGMA-ADHD data of the first and the second project were used to do prediction modelling.  

The ADHD Working Group is one of over 50 working groups of the ENIGMA Consortium, in which international researchers pull together to understand the brain alterations associated with different disorders and the role of genetic and environmental factors in those alterations. For more information about ENIGMA-ADHD please visit our website http://enigma.usc.edu/ongoing/enigma-adhd-working-group/ or contact Martine Hoogman martine.hoogman (at) radboudumc.nlenigma_300dpi

Who is the average patient with ADHD?

Is there an ‘average ADHD brain’? Our research group (from the Radboudumc in Nijmegen) shows that the average patient with ADHD does not exist biologically. These findings were recently published in the journal. Psychological Medicine.

Most biological psychiatry research heavily relies on so-called case-control comparisons. In this approach a group of patients with for instance ADHD is compared against a group of healthy individuals on a number of biological variables. If significant group effects are observed those are related to for instance the diagnosis ADHD. This often results in statements such as individuals with ADHD show differences in certain brain structures. While our results are in line with those earlier detected group effects, we clearly show that a simple comparison of these effects disguises individual differences between patients with the same mental disorder.

Modelling individual brains

In order to show this, we developed a technique called ‘normative modelling’ which allows us to map the brain of each individual patient against typical development. In this way we can see that individual differences in brain structure across individuals with ADHD are far greater than previously anticipated. In future, we hope that this approach provides important insights and sound evidence for an individualized approach to mental healthcare for ADHD and other mental disorders.

Individual differences in ADHD

When we studied the brain scans of individual patients, the differences between those were substantial. Only a few identical abnormalities in the brain occurred in more than two percent of patients. Marquand: “The brains of individuals with ADHD deviate so much from the average that the average has little to say about what might be occurring in the brain of an individual.”

Personalized diagnosis of ADHD

The research shows that almost every patient with ADHD has her or his own biological profile. The current method of making a diagnosis of psychiatric disorders based on symptoms is therefore not sufficient, the authors say: “Variation between patients is reflected in the brain, but despite this enormous variation all these people get the same diagnosis. Thus, we cannot achieve a better understanding of the biology behind ADHD by studying the average patient. We need to understand for each individual what the causes of a disorder may be. Insights based on research at group level say little about the individual patient.”

Re-conceptualize mental disorders

The researchers want to make a fingerprint of individual brains on the basis of differences in relation to the healthy range. Wolfers: “Psychiatrists and psychologists know very well that each patient is an individual with her or his own tale, history and biology. Nevertheless, we use diagnostic models that largely ignore these differences. Here, we raise this issue by showing that the average patient has limited informative value and by including biological, symptomatic and demographic information into our models. In future we hope that this kinds of models will help us to re-conceptualize mental disorders such as ADHD.”

Further reading

Wolfers, T., Beckmann, C.F., Hoogman, M., Buitelaar, J.K., Franke, B., Marquand, A.F. (2019). Individual differences v. the average patient: mapping the heterogeneity in ADHD using normative models. Psychological Medicine, https://doi.org/10.1017/S0033291719000084 .

This blog was written by Thomas Wolfers and Andre Marquand from the Radboudumc and Donders Institute for Brain, Cognition and Behaviour in Nijmegen, The Netherlands. On 15 March 2019 Thomas Wolfers will defend his doctoral thesis entitled ‘Towards precision medicine in psychiatry’ at the Radboud university in Nijmegen. You can find his thesis at http://www.thomaswolfers.com

DOES ADHD MEDICATION CHANGE THE DEVELOPING BRAIN?

Treating children with ADHD medication is hotly debated. It’s shown to be effective in reducing ADHD symptoms, but what are the long-term effects on developing brains? We asked an expert.

How ADHD medication influences the brain in the short-term has been widely studied, but many children with ADHD take medication over several years. The effects of long-term ADHD medication treatment on the developing brain have been less researched. Lizanne Schweren conducted her PhD research on this very topic, with a focus on stimulants, the most commonly prescribed ADHD medication. We sat down with Lizanne and asked her a few questions:

Photo by en:User:Sponge

What are stimulants?

Stimulants are drugs that activate the body, including the brain. Stimulants are sometimes referred to as “uppers”, as their effects tend to be energizing and pleasant. The best-known prescribed stimulant to treat ADHD is methylphenidate. For 70-80% of children, as well as adults, methylphenidate reduces their ADHD symptoms and helps them concentrate.

What happens in the brain directly after taking stimulants?

Methylphenidate blocks the reuptake of dopamine within the synaptic cleft, the gap between pre- and postsynaptic cells. Dopamine transmits neural signals from one cell to the next, and does so until the presynaptic cell transports dopamine back for recycling. By blocking presynaptic reuptake, more dopamine is left in the synapse and more signal is transmitted.

Children with ADHD often take stimulants for several years. What effect does this have on their brains?

People with ADHD, their brains look subtly different from people without ADHD. Previous studies had suggested that after long-term stimulant treatment, these differences may become smaller or even disappear. However, in my own research we found subtle differences in brain structurebetween those with and those without ADHD, regardless of treatment history. This suggests that the treatment does not in fact change the way the brain develops structurally.

Photo by amenclinicsphoto ac 

As opposed to structural differences, we did find differences in brain activation patterns when comparing children who differed in the age of onset of ADHD as well as stimulant dosage. During an fMRI experiment, the group who began taking stimulants at a young age and at a higher dose, was more likely to show activation in brain regions important for cognitive control (dorsal anterior cingulate cortex, and supplementary motor area), compared to children who took stimulants at an older age and at a lower dose. All children were off their medication during the experiment. We think that people with ADHD, who often act impulsively, may benefit from activations in these brain regions.

What do these long-term effects of stimulants on the brain mean for children with ADHD? And for clinicians prescribing stimulants?

While neuroscientists were hoping for positive – normalizing – long-term effects of stimulant treatment on the brain, parents and clinicians have mostly been concerned about potential negative consequences. For them, the fact that we found no evidence of structural brain changes associated with stimulant treatment is probably a relief. Moreover, we showed that long-term stimulant treatment does not result in better clinical outcomes. Most often symptoms of ADHD decrease during adolescence, and these improvements happen whether the child took stimulants or not. For clinicians working with patients and their parents, it is important to communicate that stimulants may temporarily improve symptoms of ADHD but they do not alter outcomes in the long-term.


Lizanne’s research is based on data linked to the Donders Institute: the NeuroIMAGE sample.

We want to thank Lizanne for the interview with the Donders Wonders.

Her thesis can be found here.


Interview conducted by Corina Greven.

Blog written by Corina Greven.

Blog edited by: Marisha Manahova.

Featured image by Jonathan Rolande.


This blog was originally published on www.blog.donders.ru.nl. This is the official blog of the Donders Institute on brains and science.

donders_banner_bilingual

Subcortical brain volumes in ADHD: the ENIGMA ADHD study

Many neuroimaging studies in ADHD have been published, each with its own contribution to science. However, brain imaging studies are expensive and therefore the sample size of studies is often small, which could result in not finding effects that are actually there. Also, different methods are used, which makes it difficult to compare studies. This results in inconsistent findings and still many uncertainties about the neurobiology of ADHD. To address these issues we founded the ENIGMA-ADHD consortium. Here, many experts in the field are united to share their expertise and their data. This way we can reanalyze existing data in large meta-and mega-analyses to try to get as close as possible to finding true effects in the brain. Our first paper was published last week in The Lancet Psychiatry and received a lot of press.

Summary of the results

We studied volume differences of 7 subcortical brain regions in >1.700 people with and >1.500 without the ADHD diagnosis from 23 collaborating institutes, with and age range of 4-63 years. We found smaller volumes for the amygdala, areas in the striatum (accumbens, caudate nucleus and putamen) and the hippocampus. The effects were small, in the order of 1 %. The differences were most pronounced in children with ADHD, differences in adults were not significant. We also studied the effects of presence of co-morbid disorders and the use of stimulants, but no effects were found. Neither did we find a correlation between the severity of ADHD (number of symptoms) and the brain volumes. Our effects are similar in size when comparing them to other psychiatric disorders such as depression (1). Compared to previous meta-analysis on brain structure in ADHD, our amygdala, accumbens and hippocampus findings are new. The amygdala finding is interesting as this structure in the brain is involved in emotion regulation and connected with many other parts of the brain. Emotional regulation problems are often mentioned in ADHD, but have not been the subject of many studies yet.

What does it mean?

…or equally important, what does it not mean: it does not mean that we can diagnose patients based on their brain scan. Effects are small and we can only identify the differences if we study large groups of patients. Neither can we say anything about cause or consequence, which was not the aim of our study. Also we need to be cautious about interpreting the age findings as this was a cross-sectional study, longitudinal studies should confirm our results.

So what can we say about our results? We have been trying to understand what ADHD is for a long time now and we use multiple levels of research to find answers to our questions. We study behavior, cognition, genetics, environmental factors and also the structure and functioning of the brain. This results in pieces of the puzzle which together should make up the picture of ADHD. The results of our study contribute to a better characterization of the neurobiology underlying the disorder by showing the amygdala, the striatal regions and the hippocampus to be implicated in ADHD. Further research into the associations with for example behavior and also the meaning of the size of the effects should give us more information on what our results actually mean.

What next?

So far we only studied 7 brain regions, and next we want to focus on the thickness and surface area of the cortex. We are also setting up a DTI study within the framework of ENIGMA-ADHD. Our dataset is open to anyone who wants to work with the data and comes up with a good idea. Currently a handful of researchers are working on side projects such as making prediction models and using machine learning algorithms. Others study subparts of particular brain regions (cerebellum). In the meantime we keep growing as a working group, welcoming new institutes at any time. We have grown to 34 participating sites with data of over 4000 participants. We especially encourage cohorts with older ADHD participants, as coverage of this age range is limited in our dataset.

enigma_300dpi

For more information about ENIGMA-ADHD please visit our website http://enigma.usc.edu/ongoing/enigma-adhd-working-group/ or contact Martine Hoogman martine.hoogman (at) radboudumc.nl


  1. Schmaal L, Veltman DJ, van Erp TG, et al. Subcortical brain alterations in major depressive disorder: findings from the ENIGMA Major Depressive Disorder working group. Mol Psychiatry. 2015.


What tube maps tell us about adhd and the brain

Most people consider the tube maps of big cities e.g. London’s tube map complex and irritating.

On the other hand, people immediately spot patterns in most tube maps. Most often, you recognize a limited number of hubs e.g. the central station. If the central station is left out, traveling gets much harder. A tube map is a compromise between a completely random net between nodes (or call it stations) and a simple, extremely hierarchical one.tube-map

Mathematicians call this a small network and developed a whole theory for better characterization of the lines and nodes (vertices and edges, in the mathematicians’ slang).

So, what has this to do with ADHD? If brain connectivity plays a role for attention and better organization of your behavior, maybe the “tube map” of an ADHD patient is not efficiently organized. This could be analyzed by measuring the brain’s activity in several regions over time and then correlating these timecourses to look which regions are tightly linked (form connections) and which regions are not (no “subway connection available between these regions”). Than one could use this theory for characterizing the brain network. That’s exactly what Robert Cary and colleagues report in the Journal Cerebral Cortex (2016;1–10; doi: 10.1093/cercor/bhw209).

They investigated 22 patients with ADHD with and without their medication and compared it to the network pattern of 31 controls.

For this, they calculated for each point in the resting-state data of the brain (so-called “voxel”) a measure they termed “node dissociation index” (NDI). The basic idea is that for a part of the brain nodes, we can define a “module”. A module for a given node is its number of links to different nodes in relation to the sum of all links (a bit more complicated, but that’s the basic idea). The Modularity in a region is the sum of the modularity of all nodes in this region. The node dissociation index is the sum of all modules in relation to the number of connections (in the specific node i and across all nodes).

When we look at the nodes number 1,5 and six, we see two highly interconnected networks in green and blue. These form two different “modules”. While node 1 has three connections to 2,3, and 4, it does not connect to the blue module, therefore its NDI is zero. Node number six is highly connected within the blue module but not to the green module, its NDI is zero. Node number 5 has four connections and one connection to the green module, therefore its NDI is 0.25.

ndi-example

In the analysis by Cary et al. the NDI (summed for specific networks like “visual”, “default mode” or “salience” ) takes values between 0.1 (visual) or almost 0.7 (salience). These measures give us a clue how tightly these networks are linked to nodes within their own communities (low dissociation indices) or whether they “dissolve” their connections and have connections to nodes which are not grouped into their own node community.

What was the effect when patients were scanned after having had a short medication wash-out? And how does this compare to the healthy controls?

The controls had lower values of the dissociation index than the patients. In patients, the visual system was not affected (very plausible!), but a variety of networks showed a decrease of the dissociation index when patients were on medication. The largest differences in networks were found in the visual attention network, the salience network and the fronto-parietal network. These networks are involved in higher order cognitive functioning and mediate psychological functions which are implicated in ADHD. The interesting take home message is, that by giving stimulant medications to patients a confuse and badly organized “tube map” (or brain network) gets a more concise structure. Graph theory offers an interesting perspective on brain networks. Future work might look in detail at how clinical phenomena are connected to brain networks or how specific comorbidities (e.g. additional addiction disorders) influence brain networks.